

• by Dr. Sarah D. Oktay, Managing Director UMass Boston Nantucket Field Station •
There is perhaps no other topic concerning Nantucket that is more of a hot button issue than erosion. All around the island we are experiencing between 0.74 to 12.0+ feet of erosion on our beaches and bluffs and dunes each year. We have some of the highest erosion rates in the state, as the island slowly and inexorably erodes on the eastern and southern shores and slowly fills in and creates larger shoals on the northern and western shores. Both Muskeget and Tuckernuck have greatly eroded on the southerly, ocean sides and filled in on the slightly more protected northern Nantucket sound side, essentially migrating slowly northward as sand is reworked and redeposited.
What is erosion and why do we need it? Erosion is the wearing away of the earth’s surface by any natural process. Around most of the world (think Grand Canyon) the chief agent of erosion is running water; minor agents are glaciers, the wind, and waves breaking against the coast. Everything that we think of when we think of soil or sediment was created by a combination of erosion by wind and water and decomposition by fungi and bacteria. Our beaches would not exist if erosion had not broken down the parent material into fine little particles. Cape Cod and Nantucket are a product of the last continental glaciation, the Wisconsinian glacial stage during which the Laurentide Ice Sheet advanced and retreated. Erosion of glacial landforms like moraines, drumlins, outwash plains, and kames provides the primary source of sand and cobble for Massachusetts’ 1,500 miles of beaches, dunes, and barrier beaches.
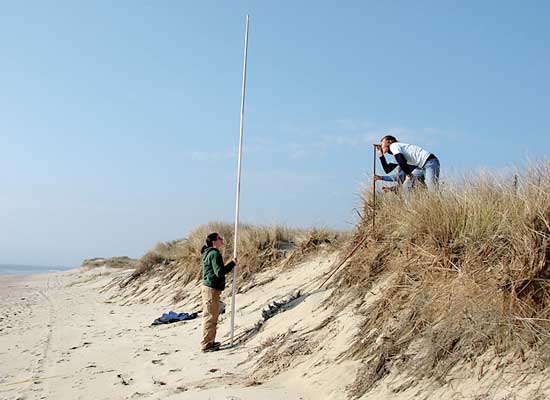
On and off for the past seven years, the UMass Boston Nantucket Field Station has been teaching visiting and local school kids how to do beach profiling while conducting regular measurements with citizens to document the loss of shoreline in some areas and the build-up in others. This project was started with Jim O’Connell, a coastal processes specialist working for the Massachusetts Coastal Zone Management (CZM) with the Woods Hole Oceanographic Institution Sea Grant Program and Cape Cod Cooperative Extension. The Commonwealth wanted to ground-truth their aerials surveys and obtain more accurate information on the high tide line to compare to the snapshot they got when flying overhead and recording the high tide line. In some cases, the on-the-ground measurements indicated that they could be off as much as 50-150 feet which is a large error when sea level rise is included. With sea level that is slowly increasing from its decadal average of 1 foot every 100 years and the potential for more storms resulting from warmer sea surface temperatures, it is critical to determine what parts of the state are at risk.
First some beach basics, and no, I am not talking about what type of swimsuit to wear or whether SPF 30 or 60 is better (perhaps another column). The parts of a beach include in order of distance from the low tide line: the Intertidal area, forebeach, midbeach/berm, and back beach. The “foreshore/forebeach” is the sloping portion of the beach between high and low tide. The “swash zone” is the intertidal area of wet sand where the most recent high and low tide resided. The “wrack line” is the line of deposited vegetation (algae, eelgrass, etc.) and other floating material on the shoreline marking the extent of high water; wrack lines can usually be seen for the most recent high tide and the highest one of the week and sometimes are even evident for the highest tide of the year. “Grain size” refers to the diameter of sand particle as measure by sorting through a series of sieves. Low energy beaches have very fine sand, high energy beaches have coarser sand and very high energy beaches are rocky. A “berm” is a nearly horizontal rise that looks like a land based sand bar and is formed when the waves deposit sand on a beach. A storm berm can mark the highest limit of storm waves. Several berms can occur at spring and neap tide levels. The “back beach” or “backshore” is rarely touched by wave action and ends at the edge of the first dune. The “active dune” or “primary dune” is the first dune. “Fixed dunes” or “secondary dunes” can follow, sometimes in great numbers. A swale is the hollow between dunes, often close enough to the water table so that marsh plants or peatland plants can get established.
Longshore drift is the term for the movement of sand grains along a beach by waves. Waves that approach the shore at an angle (which is more common than waves approaching head on perpendicularly) rush diagonally up the beach. The water then returns directly down the beach under the force of gravity. Sand grains carried by the rush and backwash of the waves are moved along the beach in a sawtooth fashion. Other grains are carried along just seaward of the beach by the longshore current, which is also generated by the oblique approach of the waves. Longshore currents and longshore drift are generally considered to be constructive processes. Unlike storm waves, they are not significant in coastal erosion. They are the continuing processes that nourish the beach and carry sand along the shore of a barrier spit to deposit it at the end of the spit so that the spit grows in length.
Massachusetts includes 1500 miles of tidal shoreline, 78 coastal communities, 681 barrier beaches and 36,000 people live within 500 feet of a coastal shore. Approximately 72% of the Massachusetts shore is exhibiting a long-term erosional trend and this trend has accelerated since 1950. Nantucket has the highest erosion rates in the state, with parts of the southern side losing 12 feet per year on average. Storm generated erosion ranges over periods of hours (tropical cyclones) to several days (northeasters). Although the storm events are short-lived, the resulting erosion can be equivalent to decades of long-term erosion. The actual quantity of sediment eroded from the coast is a function of storm tide elevation relative to land elevation, the duration of the storm and the characteristics of the storm waves. During severe coastal storms, it is not uncommon for the entire berm (dry beach above the normal high water line) and part of the dune to be removed from the beach. The amount of erosion is also dependent on the pre-storm width and elevation of the beach. Repeated small storms can do a lot of damage because the beach is more vulnerable to sand loss. In fact, the cumulative effects of two closely spaced minor storms can often exceed the impact of one severe storm as we saw this past spring with the nor’easters “Nemo” in February and “Saturn” in March occurring not all that long after Superstorm/Hurricane Sandy and doing more damage than Sandy to many parts of the island. Sandy was the second most costly hurricane in the U.S (68 Billion dollars) only surpassed by Hurricane Katrina. So although hurricane erosion can be serious and dramatic, in the long run, it is the northeast storms that do the most damage (woodshole.er.usgs.gov/staffpages/boldale/capecod/quest.html “Coastal Erosion on Cape Cod: Some Questions and Answers by Robert N. Oldale”).
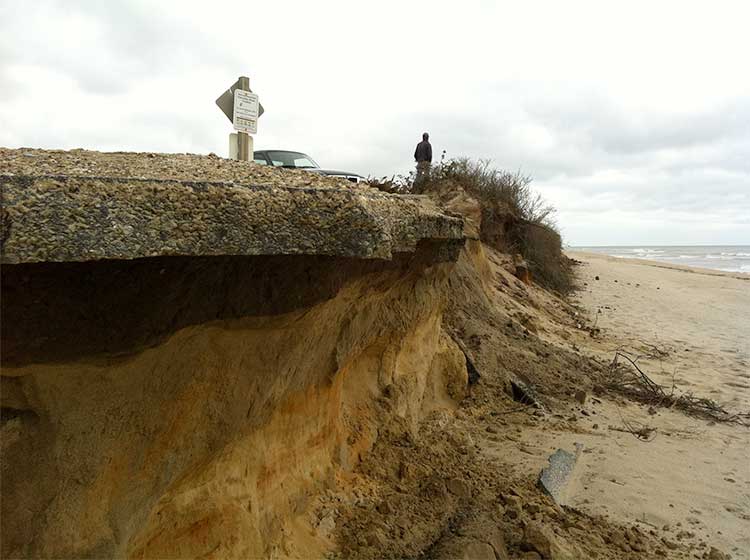
The field station has been photographically documenting the loss of coastal bluff at Tom Nevers for almost 30 years now as buildings, roads, and tons of bluff material composed of poorly sorted sand, larger gravel and fine clays slough off the beach escarpment face and wash into the nearshore area to be carried along by longshore drift and deposited in sandbars off shore circling the island or on beaches down drift. It is easiest and most accurate to think of our shifting shoals and the sandbar we live in as a system. Most of the sand stays in the system, but some sand is transported in storm events offshore in holding patterns of offshore sandbars. These bars also migrate and as they do, areas of the shore that were protected by waves become exposed and start eroding at a faster rate (more about that below). Codfish Park in Sconset and Smith’s Point/Esther’s Island in Madaket are two of the better examples of variable erosion and accretion on island.
Each winter, our beaches become much steeper and shorter. Here’s a graph done by Max Duce and Stefan Silverio, students at the Nantucket New School who worked with me this spring on a two month long research project to evaluate winter beach dynamics by doing beach profiles at Cisco and Sconset. These guys did a great job, especially since my early profiles dating back to 2004 have been buried under 6 feet of sand in the case of Codfish park because of the drastic shortening of the beach. The best way to explain it is like a six foot tall 200 pound person overnight becoming a 4 foot tall 200 pound person, same amount of sand, but a very different profile.
From “ Beach Profiling” paper and presentation June 2013 by Max Duce & Stefan Silverio, 8th grade Nantucket New School.
During summer’s gentler wave climate; with more southerly breezes, the sand moves back into place and the beaches lengthen by many feet, become much flatter and typically a bit lower in elevation. Our profiles show this process occurring each year in areas like Codfish Park in Sconset, which can shorter by 50-100 feet in the winter and become much steeper. Many beach areas develop a “stair-step effect” as mini escarpments are created as storms carve out larger chunks of shore. This material migrates around the island in shoals offshore. Each of these shoals may protect a part of the island for dozens of years, but then it eventually migrates (in the case of the eastern side off Sankaty) south; or on the southern shore, to the west, exposing areas to erosion that previously were protected. Nantucket has experienced trend reversals, in which sand has built up for many years, in an accretion cycle, then reverses to an eroding cycle to show a deceptively minor average erosion of only a foot or so per year.
The time period one examines shoreline changes makes a big difference when trying to figure out if it is eroding or accreting. Over long time spans, sometimes erosion and accretion are approximately the same, but that is no solace on a decadal or yearly time scale. For instance on the southern shore near Surfside, Massachusetts Coastal Zone Management found that “In many cases, short-term shoreline fluctuations can be orders of magnitude greater than the long-term rate of shoreline change. For example, Nantucket’s southeast shore has a long-term average shoreline change rate of +0.10 feet per year for a “net” accretion of 2.1 feet between 1846-1978, suggesting a relatively stable area. However, between 1846 and 1978 the shoreline accreted 238 feet, then eroded 236 feet. This same phenomenon occurred at Codfish Park on the eastern shore of Nantucket. Unfortunately, many homes were constructed during the accretion phase. Since the trend reversed to erosion beginning in the mid-1950s, many houses have been lost to erosion and storms.“ from http://www.whoi.edu/seagrant/page.do?pid=51817&tid=282&cid=88713 accessed June 16th 2013). No duh.
According to the Army Corps of Engineers, coastal geologists, and coastal process experts, the most important cause of human-induced erosion is interruption of sediment sources and longshore sediment transport. Examples include the armoring of sediment sources with seawalls, revetments, and bulkheads, and the interruption of longshore sediment transport by the construction of groins and jetties. Coastal erosion, sand transport, and deposition are the natural processes that are responsible for the Cape as we know it. The cliffs on east side of the island off Baxter Road erode to form the beach below and to the south and north emanating from a nodal point that pushes some sand north, some south as winds evolve from winter to summer (and to complicate matters, the node itself moves/migrates a bit). Jetties and groins generally do not stop erosion, but interfere with longshore drift and longshore currents to stop the passage of sand along the beach and reduce the natural build up of sand on a beach. Other types of loss that occur on a beach where revetments have been built include scouring, where banks and beach material is lost on either side of a structure, impoundment loss mentioned above where sand can’t be provided any longer (also known as starving a beach), placement loss for the beach itself under the rocks, and passive erosion which occurs because the back beach is fixed in space and can’t go back landward, as sea level rises the beach is submerged (from “Collecting & Using Economic Information to Guide the Management of Coastal Recreational Resources” March 2012- a doctoral dissertation by Chad Nelsen at the University of California Los Angeles http://public.surfrider.org/files/nelsen/Chapter4-BeachSandMitigation.pdf
How does sand accumulate on a beach?? It seems we are always talking about losses. Sand is transported over the sea bed towards the beach when waves ‘stumble’ such that their crests become narrower than their troughs. This produces a swift forward flow followed by a slower backward flow. On the beach the top of the wave breaks and mingles with the foot of the wave, both dashing forward with a force driven by the energy from the height and speed of the collapsing wave. The resulting rush of water is fast and strong and moves sand effortlessly up the beach. The water then comes to a rest as the sand particles settle out. The water then begins flowing back down the beach, first slowly and then faster until it dislodges cohesive sand grains. But the forcing power is much less than that of the on-rushing waves. The particles that settled at the top of the forward rush stay because of the hysteresis (lagging behind) between erosion speed and settling speed. Thus sand settles on the beach only when the tide recedes. Cusps form when wind and waves come from along-shore, or at an angle to the beach. If wind comes onshore directly, cusps are less likely to form.
It is always helpful to collect several hundred grams of beach sand and bring it back for measuring through a series of sieves which sort the material into various grain sizes. The average amount of energy and wave and wind action that a beach endures is measured in its tiny grains of sand. Large, poorly sorted and angular (sharper edged) material indicates a beach that experiences high energy, large waves, and windy conditions. Fine sand that is well sorted indicates that the beach experiences relatively gentle waves that leave these finer particles behind. Max and Stefan also diligently sieved several samples of sand. That effort takes hours and hours and is exhausting. Yep, poor guys literally pounded sand. I helped them out for the last two-three hours. They found that the most common grain size of sand on the beaches in the intertidal areas in March and April was 500 micrometers (0.0195 inches) with 77% of that in the Cisco beach samples and 79% in the Codfish park samples. The sand was finer, and varied in size more high up on the beach in the back beach where beach grass entrained finer particles.
Just a few months ago, Julia Knisel with the department of Coastal Zone Management came to Nantucket to give a public forum for the Coastal Management Workgroup (I am currently the chair) updating us on state information on erosion, obvious adverse impacts of some hard armoring and the most recent coastal shoreline change maps. Her Powerpoint can be found at http://www.nantucket-ma.gov/Pages/NantucketMA_BComm/cmp_files/Nantucket_Shoreline_Change_20130321.pdf and I’ll be synthesizing and translating some of the information when I continue this article next week. I’ll talk a bit more about barrier beaches next time, which can be even more dynamic and give some more facts and tidbits on coastal processes and the habitat within the grains of sand. Check out this “oldy but goody” article to learn more about barrier beach mechanisms. http://www.mass.gov/czm/hazards/pdf/barrier_beach_guidelines.pdf. I also highly recommend this site http://woodshole.er.usgs.gov/staffpages/boldale/capecod/index.html in which Geology expert for the Cape and Islands, Robert Oldale, who has written two seminal books on Cape Cod Geology explains coastal erosion for the Cape. More about his work can be found at http://woodshole.er.usgs.gov/staffpages/boldale/.
Some portions of this article were previously published in August 11th 2011 issue of Yesterday’s island.
Read Part 2 – Barrier Beaches.