

• by Dr. Sarah D. Oktay, Managing Director UMass Boston Nantucket Field Station •
Mapping the Ocean Floor
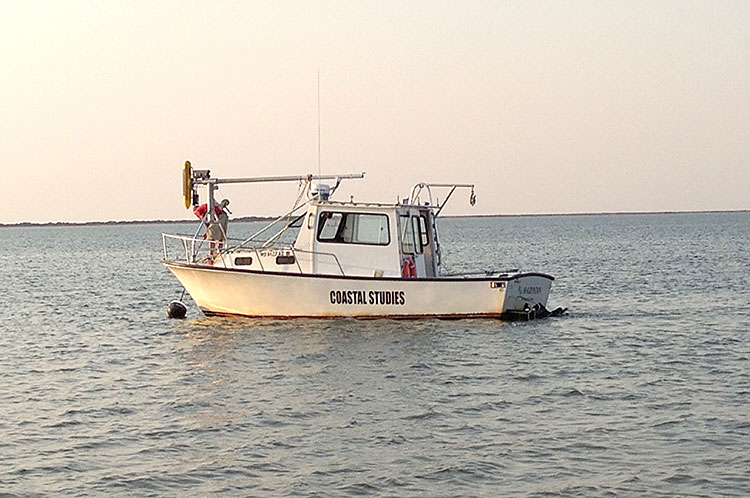
The UMass Boston Nantucket Field Station has the use of a new toy, and boy what a toy it is! In late August, Dr. Mark Borelli of the Provincetown Center for Coastal Studies in collaboration with the Field Station brought his 22 foot Parker type boat outfitted with a shallow water multi-beam high resolution acoustic device down to Nantucket to map the harbor and sea floor off the east coast of Nantucket. Each year he’ll come down and map more of our seafloor as we gather data to better understand the shifting sands and eelgrass beds around the island.
We will be looking at the bathymetry and composition of the seafloor. Bathymetry is the study of the underwater depth of lake or ocean floors. In other words, bathymetry is the underwater equivalent of topography. The name comes from Greek words βαθύς (bathus), for “deep” and μέτρον (metron), for “measure”. Bathymetric (or hydrographic) charts are typically produced to support the safety of surface or sub-surface navigation, and usually show seafloor relief or terrain as contour lines (called depth contours or isobaths) with selected depths (also called soundings) shown on charts in order to provide surface navigational information. No one wants to find a large rock or wreck the hard way! The term “sounding” derives from the Old English “sund”, meaning “swimming, water, sea”; it is not related to the word “sound” in the sense of noise or tones (from http://en.wikipedia.org/wiki/Depth_sounding retrieved September 8th, 2013). With the use of acoustic technology we can arrive at a satisfying return to its homonym.
Originally, bathymetry involved the measurement of ocean depth through depth sounding. Early techniques used pre-measured heavy rope or cable lowered over a ship’s side. This technique measures the depth only a singular point at a time, and is pretty inefficient. It is also subject to movements of the ship as it is tossed about in the waves and currents moving the line out of true and therefore is inaccurate (from http://en.wikipedia.org/wiki/Bathymetry retrieved September 8th, 2013.) I find when I used a weighted Secchi disk in the jetties channel with an outgoing ebb tide which can create a fast current that even with a relatively heavy lead weight on the bottom it still can fly like a sail and refuse to sink straight down. A Secchi disk is a contrasting black and white disk invented in 1856 by Pietro Angelo Secchi to measure the transparency of water and was modified to the current black and white wedges used today by George Whipple (cofounder of the Harvard School of Public Health) in the late 1880s. Mine are so old that I am pretty sure I have Whipple’s original secchi disk. It is a testament to the endurance of this method that we still tie a heavy object onto a line marked at intervals to determine the bottom. And of course most mariners use some type of “fish finder” or acoustic device to see differences in density whether from the bottom or schools of fish to navigate.
Traditional terms for soundings are a source for common expressions in the English language, notably “deep six” (a sounding of 6 fathoms). The distance of a fathom was determined as the wingspan or distance between the average man’s outstretch arms (also roughly proportional to height so at 5’2” I would not be helpful) used to measure each wet section of line coming up over the side of the boat as it was pulled in. On the Mississippi River in the 1850s, the leadsmen also used old-fashioned words for some of the numbers; for example instead of “two” they would say “twain”. Thus when the depth was two fathoms, they would call “by the mark twain!” The American writer Mark Twain, a former river pilot, most likely took his pen name from this cry. The term lives on in today’s world in echo sounding, the technique of using sonar to measure depth.
The instrument used was originally leased by Dr. Mark Borelli at the Provincetown Center for Coastal Studies to complete a project for the Massachusetts Department of Environmental Protection (DEP) Coastal Zone Management (CZM) to investigate sediment transport and coastal features from Race Point in Provincetown to Wellfleet. As a chemical oceanographer who has spent many years in a previous life taking offshore sediment samples to look at deposition, I spoke with Mark earlier this year and we came up with a plan to take his show on the road down to Nantucket. By helping to purchase the equipment, we were able to make sure Mark had it on hand all the time and we could commission acoustic mapping of Nantucket’s coastal waters. The equipment used is a state-of-the-art interferometric sonar system that collects coincident (matching point for point) bathymetry and acoustic backscatter imagery. Backscatter is the retroflection of waves, particles, or signals back to the direction from which they came. Interferometric sonar yields coincident backscatter imagery and bathymetry. These two data sets collectively yield more information when overlaid on each other to yield a very detailed image of the seafloor, including eelgrass beds, wrecks, rocks and other items of interest. The acoustic backscatter data will ensonify (great word!) or ‘take a picture’ of the seafloor using sound. Ensonify (also spelled insonify) is an acoustic term which means: “to fill the ocean or any fluid medium with acoustic radiation, which is then observed and analyzed to study the medium or to locate or image objects within it.” (from http://www.answers.com/topic/ensonify retrieved September 8th, 2013).This technique along with the collection of sediment samples and underwater imagery and/or video will provide detailed information with regards to the surficial seafloor geology including grain size, composition, bedforms (rivulets, wave forms, mounds and sandbars) as well as submerged aquatic vegetation like eelgrass and other biota (from http://www.coastalstudies.org/what-we-do/land-sea/nearshoremapping.htm retrieved September 8th, 2013).
The boat Mark uses has two different sonar systems, one on a boom that is lowered in front of the boat and one that is towed behind. The distance between these two objects is known. Phase Differencing Bathymetric Sonar (PDBS) systems, also referred to as interferometric sonar, use the measurement of phase at each of several receive elements (in the front and back of the boat there are multiple receivers) to determine the angle from which the acoustic return originates. So what does this mean in plain English? Systems equipped with this have several receivers just a few inches apart. An acoustic signal is sent from a pinger which bounces the sound down to the sea floor a little like we do when we yell across a canyon and listen for an echo. As that echo bounces off object, it is “heard” by each receiver. Since we know the distance each receiver sets from the other and we can hear the sounds return on the front and back of the boat, we can calculate the angles of return of the objects bounced sound and get a very accurate picture of the size and shape of the object with centimeter accuracy (more at http://www.nauticalcharts.noaa.gov/csdl/PDBS.html retrieved Sept. 8th, 2013. In his first surveys, Mark found large (up to six feet in diameter) boulders off ‘Sconset as he did his surveys from Sesachacha to Low Beach and many mooring blocks and a sunken boat or two scattered around the harbor. Over the next few years we will be mapping the south, west, and north sides of the island. We will also be sharing his information with Charlie Costello who maps the eelgrass beds around the state for Massachusetts’ DEP (more at http://www.mass.gov/dep/water/resources/egtrends.pdf retrieved September 8th, 2013).
This equipment is efficient, reliable, and can be deployed in very shallow water. It also collects data in a very wide swath (10:1 versus the 3:1 swath of typical multibeam bathymetry system) which means it can image more of the ocean floor collecting data faster and allowing for more research. In the past, people used a single array of sound equipment to collect images of the bottom that would not be as detailed that they would then compare to LIDAR. LIDAR is a remote sensing technology that measures distance by illuminating a target with a laser and analyzing the reflected light. The acronym LIDAR, depending on whom you ask, comes either from combining the words light and radar or as an acronym for “Laser Interferometry Detection and Ranging”.
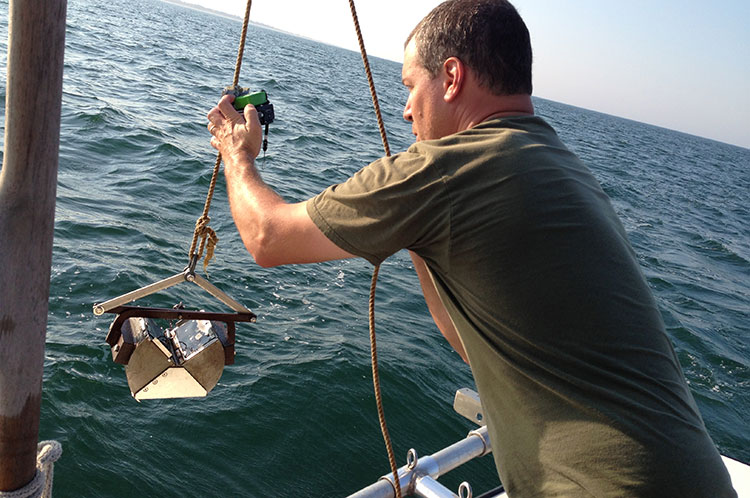
Mark also uses this equipment to monitor how sand placed in nearshore coastal areas moves around and can be used to heal or augment beaches and sandbars destroyed in ocean storms. He collects sediment samples using a Ponar grab and attaches a “Go-Pro” underwater camera to record the sediment grab and evaluate the sea bottom. An innovative approach that he is using in a project in collaboration with my UMass Boston colleague, Dr. Anamaria Frankic involves using the acoustic system to map oyster beds in rehabilitated areas to make sure the oysters have survived their implantation in restoration efforts. The pictures in this article were taken by Theresa L. Smith who is a research geologist working with Dr. Borelli in the Marine Geology Department at the Provincetown Center for Coastal Studies. Next week we will look at LIDAR and what it is used for around the country and on Nantucket.